Today came the announcement that it finally happened: Boston broke the all-time seasonal snowfall record today! This winter, 275.8 cm (108.6 inches) of snow has fallen at the Boston Logan station. The previous record was set 19 years ago, when 273.3 cm fell in the winter of 1995-1996. Those who experienced that winter now officially have their bragging rights revoked!
When I got to Boston at the end of January it was quickly becoming clear that February was quite exceptional, and record after record fell. We had the snowiest 7 days on record, the snowiest 30 days, the snowiest February, ... However, as close as we were to the all-time record at the beginning of March, there was no guarantee for breaking it and there were 11 snow-free days until the record was finally set today. With a taste of spring, the record-fever disappeared, until somewhat unexpectedly the last few centimeters of snow fell today!
Fascinated by the immense amounts of snow, and mildly frustrated that all measurements were announced in inches rather than in centimeter, I decided to download the snowfall data and make my own figures.
The cumulative snowfall shows all previous snowfalls per winter, and highlights the previous top 3, as well as this year's record. For convenience I have reported values both in centimeter and inches. The data was gathered as Boston Logan weather station, which has data that goes back to 1936, although I have not included the first two years because it appears to contain some erroneous measurements. Since 1938, the data is uninterrupted and winter and summer, the snowfall is measured daily. The data can be freely downloaded from the National Oceanic and Atmospheric Administration (NOAA) I have divided it into seasons which are shown as grey lines. Their average is shown in black, which is calculated by counting days since the start of the winter to deal with leap years. (The data analysis which produced the figures was done in Python. The figures may be freely reused as long as their source is credited.)
What is obvious from the cumulative snowfall figure is that this winter's snow was heavily concentrated around February (when do you think I arrived to Boston?). The following figure shows snowfall during the past 30 days at any date:
This means that any point in this figure represents how much snow has fallen during the 30 days prior to it (including the day itself). On February 22, 239.7 cm (94.4 inch) of snow had fallen in the previous 30 days! It's clear that nothing like that has happened in the 77 previous years. A similar (though slightly less impressive) figure can be made for a 7-day window.
Finally, I have attempted to describe the seasonal snowfall by a simple Gaussian distribution. The best fitted distribution has a mean snowfall of 111.1 cm, with a standard deviation of 53.1 cm:
However, when this distribution is illustrated in a histogram, it is clear that a Gaussian distribution does not provide a great fit. For one, true snowfall obviously never goes below zero (in fact, the least observed is 23.7 cm). Snowfall in the range of 40-150 cm is fairly common, with a few exceptions exceeding that range, such as the winter of 1947-1948, 1993-1994, 1995-1996 and now 2014-2015.
Finally, is there much more snow to come? That's hard to say. Looking at the cumulative snowfall (top figure), the black curve (indicating the mean) is clearly starting to flatten out, indicating most snow has most likely fallen by now. Nevertheless, snowfall in March (and April) has a significant scatter, with some seasons getting no snow at all and others getting 1-2 significant storms.
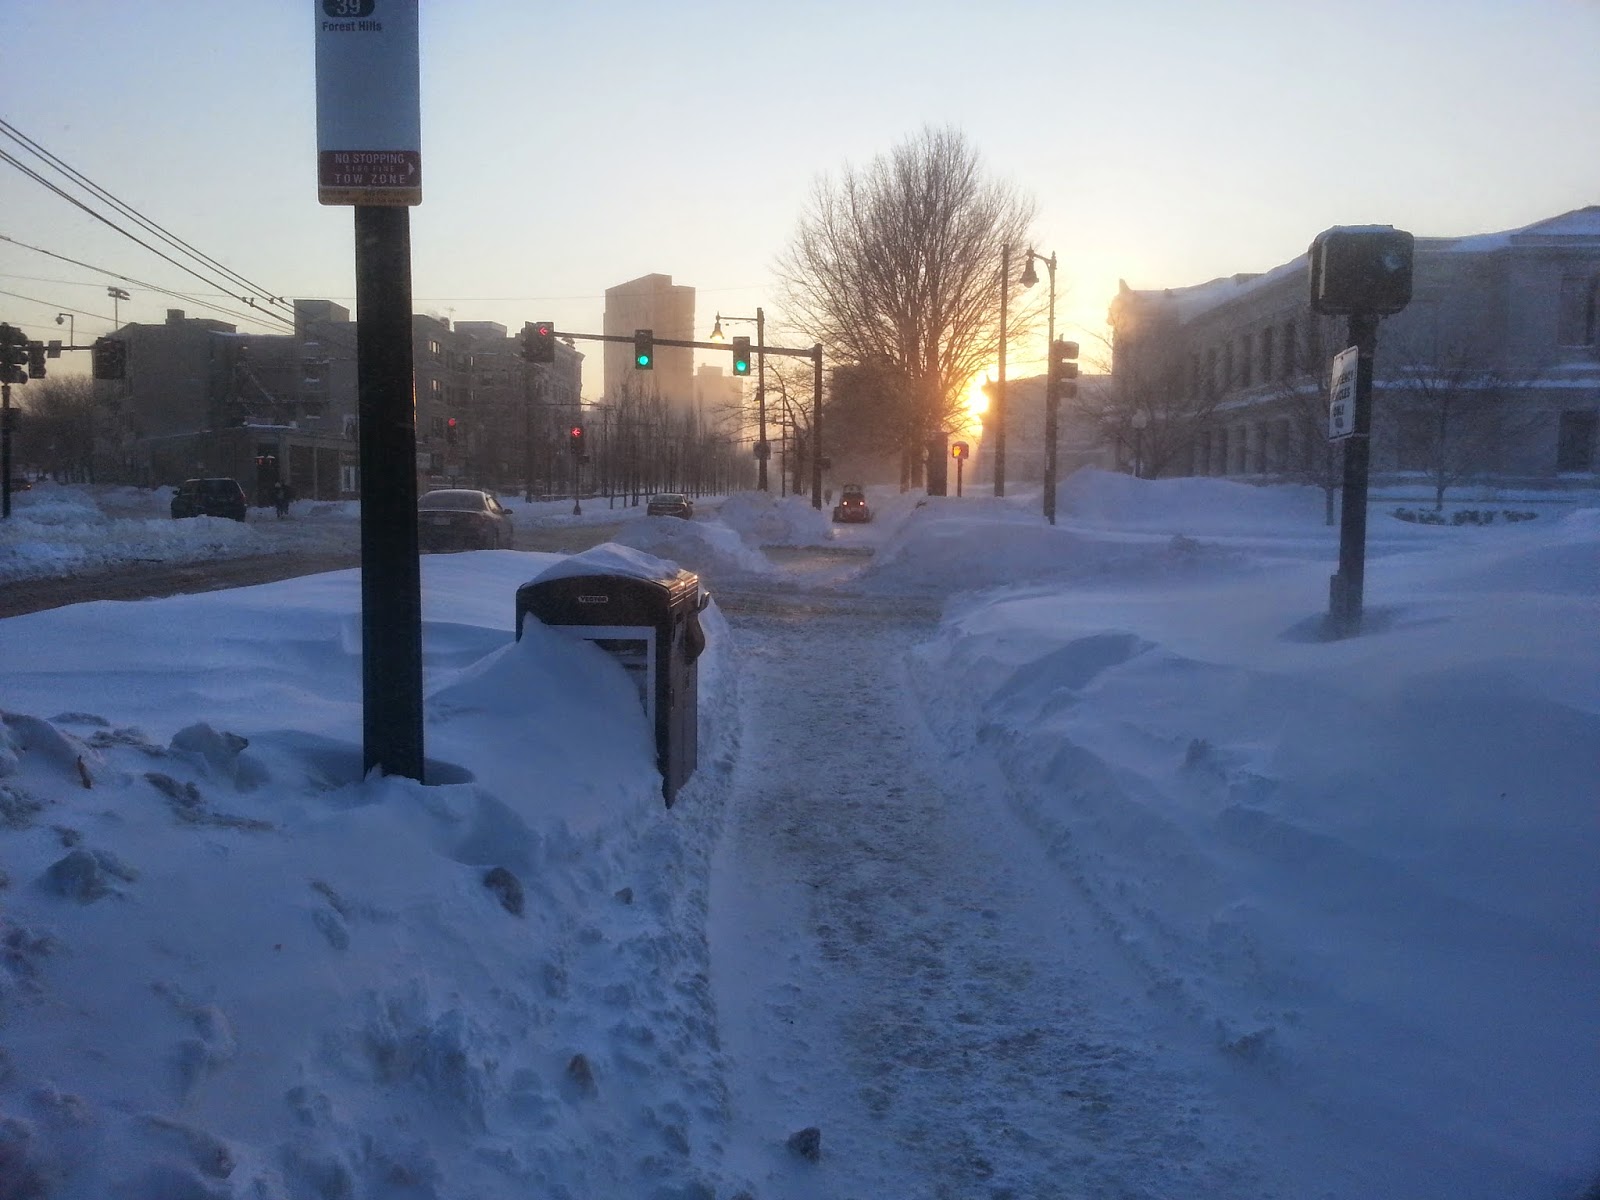
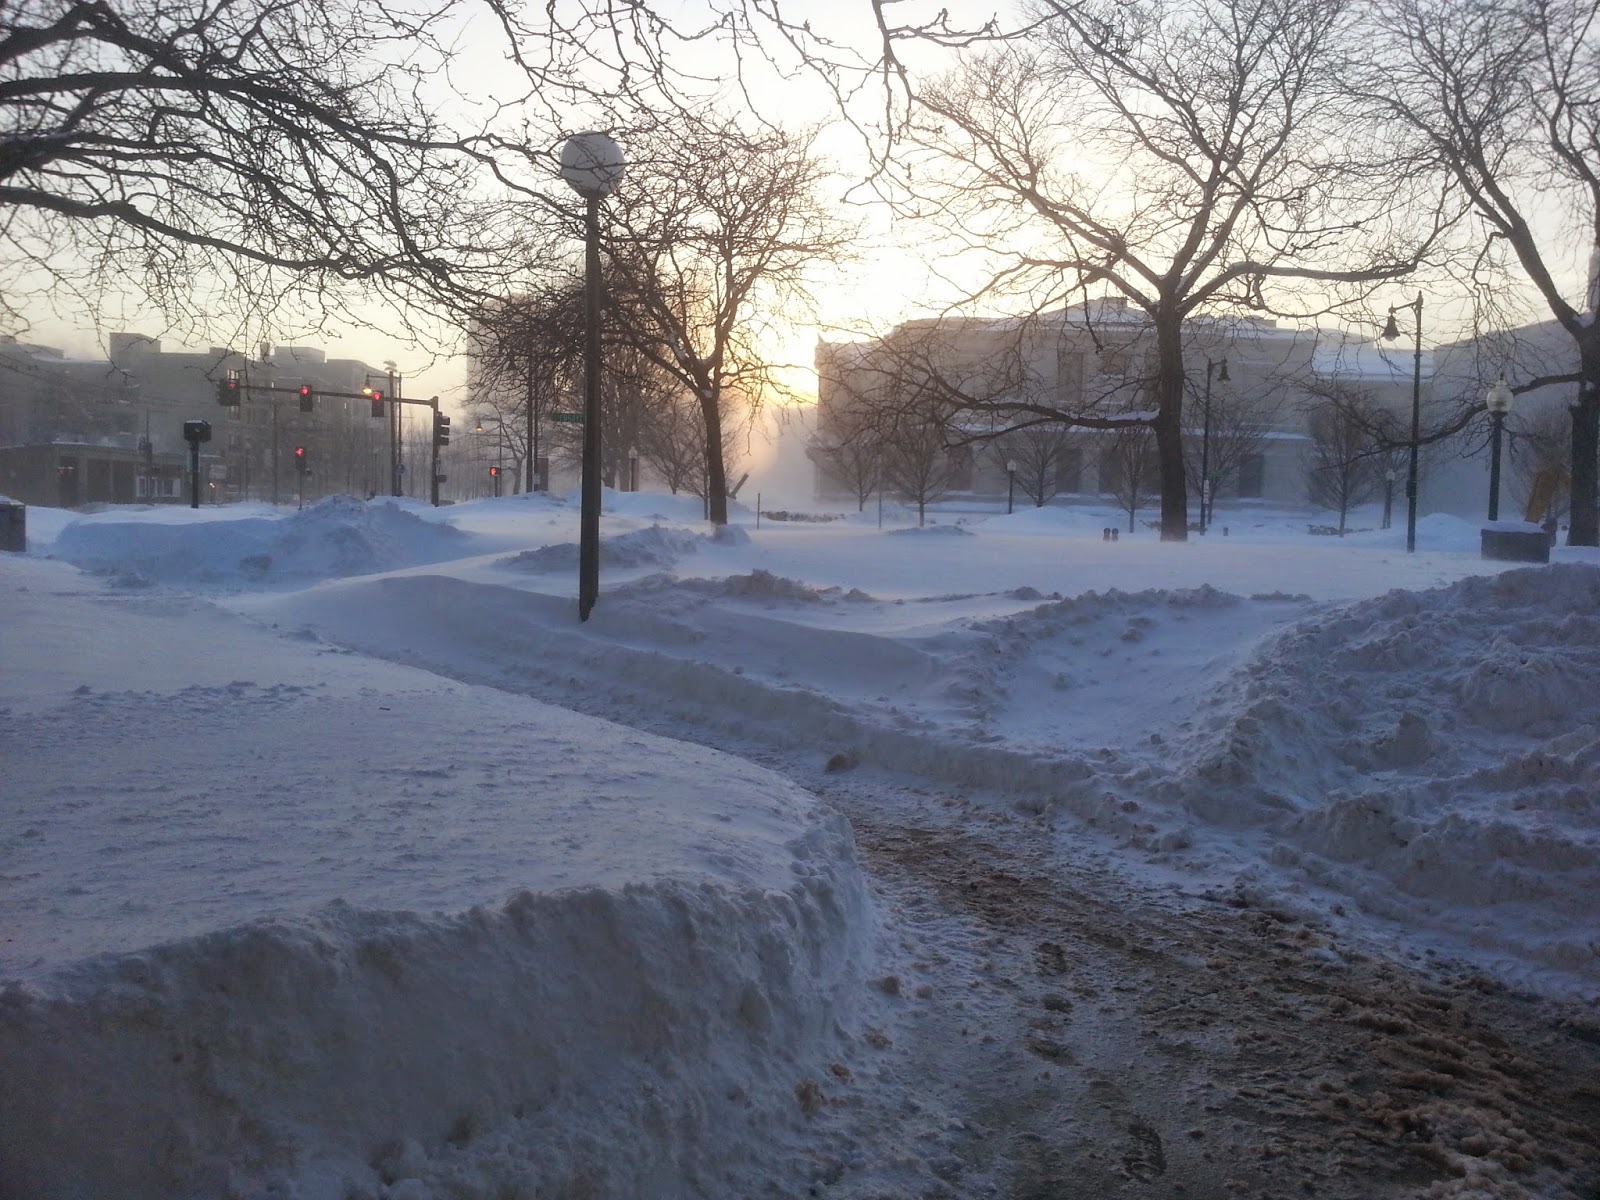
Below are some snowy pictures. To be fair, most were not taken in the last few days, and the city looks quite a bit less surrealistic these days. Some pictures were taken at an area which was used by MIT to collect the snow removed from its campus, a place which became known as The Alps of MIT.


